Muhammad Hanif1,2 ![]() ,
Nida Nazer1,
Vesh Chaurasiya2,
Usman Zia1
,
Nida Nazer1,
Vesh Chaurasiya2,
Usman Zia1
For correspondence:- Muhammad Hanif Email: muhmmadhanif14@yahoo.com
Received: 21 March 2015 Accepted: 11 January 2016 Published: 31 March 2016
Citation: Hanif M, Nazer N, Chaurasiya V, Zia U. Simultaneous determination of famotidine and flurbiprofen by high performance liquid chromatography. Trop J Pharm Res 2016; 15(3):605-611 doi: 10.4314/tjpr.v15i3.24
© 2016 The authors.
This is an Open Access article that uses a funding model which does not charge readers or their institutions for access and distributed under the terms of the Creative Commons Attribution License (http://creativecommons.org/licenses/by/4.0) and the Budapest Open Access Initiative (http://www.budapestopenaccessinitiative.org/read), which permit unrestricted use, distribution, and reproduction in any medium, provided the original work is properly credited..
Purpose: To develop a selective, sensitive and accurate simultaneous High Performance Liquid Chromatography (HPLC) method for the analysis of flurbiprofen and famotidine tablet dosage form and excipients.
Methods: A simultaneous method for the determination of the two drugs was employed. The assay consisted of isocratic elution of flurbiprofen and famotidine in prepacked Column RT 250-4.6 Purospher® STAR RP-18 end-capped (5 µm), using a mobile phase composed of acetonitrile and phosphate buffer (pH 3.7) in a ratio of 1:1, respectively, as well as an ultraviolet (UV) detector. Flurbiprofen and famotidine were both detected at 265 nm at a flow rate of 1 ml/min following the guidelines of International Conference of Harmonization (ICH).
Results: A sensitive and linear range of 10 to 100 ppm with 0.999 coefficient of correlation for famotidine and flurbiprofen were observed. Blank and placebo showed no interference with the peak retention time of flurbiprofen and famotidine. Recovery of 50 mg famotidine was 99.61 % after 12 h and 99.76 % after 7 days and for flurbiprofen 20 mg it were 99.60 % after 24 h and 99.85 % after 7 days.
Conclusion: Good precision, recovery and accuracy data indicate the reliability of the proposed method. The method may also be suitable for use in bioequivalence studies.
Introduction
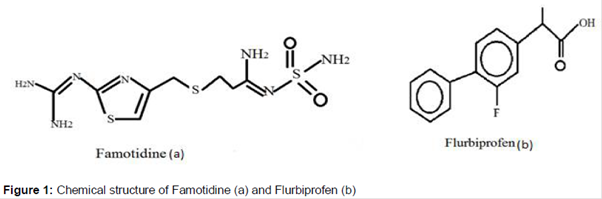
Recently, there is a trend towards combined therapy for the treatment of various diseases and disorders that require long-term therapy such as arthritis and osteoarthritis. The main advantage of combined therapy is to counteract the destructive effects of one drug. [1]. Chemically Famotidine is 3-([2-(diaminomethyleneamino) thiazol-4-yl]methylthio)- N'-sulfamoylpropanimidamide which is H2-receptor antagonist used for treating and preventing gastric & duodenal ulcers [2-5] and flurbiprofen is known as (RS)-2-(2-fluorobiphenyl-4-yl) which is propionic acid [6]. Structure of both drugs are shown in .
Bi-layer tablets are drug delivery system in which two drugs are combined in a single unit. Simultaneous method validation is used to affirm that analytical method for specific test is suitable or not. Results of method validation can be confirmed for their quality, reliability and consistency of analytical results. Various methods have been discussed in the literature for determination of Famotidine and Flurbiprofen tablets like spectrophotometric analysis [2], potentiometric [7], electrochemical, Flow injection analysis (FIA). Among them, High performance liquid chromatography is precise, specific, rapid and simple. There is a need of such HPLC methods for detection of two drugs in a single dosage form.
The object of this study is to formulate the bilayer tablets of Flurbiprofen and Famotidine by establishing new HPL analytical method of both drugs. Famotidine was used as immediate release (IR) and Flurbiprofen hold as sustained release (SR) effect. Validation of the method was carried out by evaluating the accuracy, precision, stability, system suitability and precision of the method.
Methods
Instruments and apparatus
Analytical balance (Electronic Balance Model AED-300), High Performance Liquid Chromatographic system (SYKAM S5111), Prepacked Column RT 250-4.6 Purospher ® STAR RP-18 end capped (5 µm), Rheodyne manual injector fitted with a 20 μl loop syringe (SGE Company, Australia), ultrasonic bath (Shenzhen Co. China) membrane disc filters (Millipore, 0.45 µm pore size, Millipore Corporation, Billerica, USA).
Chemicals
Famotidine and Flurbiprofen both were gifted by Zakfas pharmaceutical (Pvt) Ltd Multan, HPMC (Methocell K4M, Dow Chemical Co., USA), Avicel PH 102 (FMC, Brussels, Belgium), Carboxymethylcellulose (Ac-di-sol®, FMC biopolymer, USA). Potassium dihydrogen phosphate, methanol, phosphoric acid and sodium hydroxide all were purchased from Merck, Darmstadt, Germany and were of analytical grade. Double distilled water was used in whole study.
Compression of bilayer tablets
Single punch machine was used for compression of bilayer tablets in such a way that sustained release layer of Flurbiprofen granules were compressed initially and then immediate layer of Famotidine was compressed by direct compression. Oblong faced punch was used for compression of 20 mg Famotidine and 238 mg Flurbiprofen for obtaining the weight ranges of 827 to 1011 mg in each tablet. Similar composition of placebo (without active pharmaceutical ingredients) formulations were also compressed by same single punch machine for comparative study.
Preparation of buffer, mobile phase and stock solutions
Phosphate buffer solution of pH 3.7 was mixed with acetonitrile with the ratio 1:1. A stock solution of different strengths, i.e., 1 mg/ml of Flurbiprofen and Famotidine was prepared which was further diluted in 100, 50, 25 and 10 ppm were prepared in the mobile phase.
Method validation
The validation parameters determined were linearity, selectivity, accuracy, precision, system suitability, solution stability, Limit of detection (LOD), and Limit of quantification (LOQ) as per the guidelines of ICH Q2B [8].
Specificity
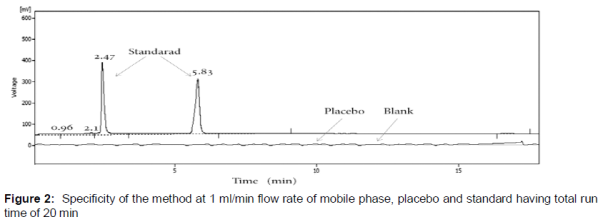
The specificity of the method was used to differentiate between the analyst and the components in the sample. Interference between the solvents and formulation chromatograms of six replicate injections of placebo with standard Flurbiprofen and Famotidine were evaluated for specificity [9].
Linearity (calibration curve)
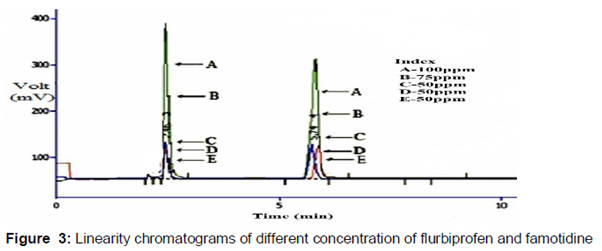
To calculate the linear relationship between the range of concentration of the API and the detector response linearity curve was used. Linearity was assessed by forming the dilution in such a way that 50 ppm was kept as a central point, two high and two lower concentrations were prepared from stock solution and the linearity curve was developed [9].
Reproducibility and accuracy
Spike Placebo method was used for calculating the accuracy [10]. Sample solutions with 10, 25, 50, 75 and 10 ppm concentrations were prepared and spiked with placebo solution.
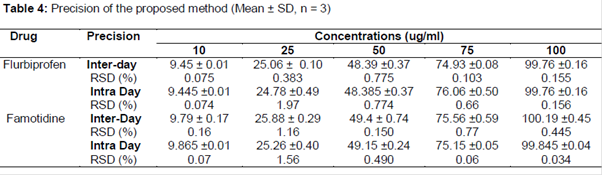
Inter- and intra-day precision
Analysis of Inter-day precision was carried out by selecting five concentrations for three consecutive days, whereas intraday precision was carried out by using five different concentrations i.e., 10, 25, 50, 75 and 100 ppm [11].
System suitability test (SST)
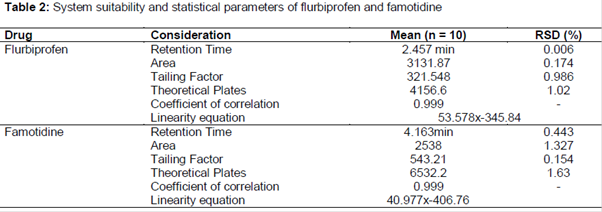
The system suitability was assessed with the initial mobile phase composition, followed by 10 injections of the same standard. The purpose of injecting 10 consecutive injections was to evaluate the system suitability on each day of method validation. Parameters like capacity factor > 2, resolution > 3 and asymmetric tailing factor < 2, theoretical plates of column > 3000 were calculated. All parameters were recorded by Clarity Lite Chromatography Station for windows [12].
Theoretical plates
Following equations were used to evaluate the theoretical plates of the reports [15,16].
h=L/n ……………………………………… (1)
n=16(t/Wb)2 ...……………………….......... (2)
where h = theoretical plate values. Wb is the peak width of base, t is Retention time and L is the length of column.
Tailing factor
T=w/2f………………………………………… (3)
where w is the width at 5 % of peak height and f is the distance between the maximum and leading edge of the peak.
Solution stability
For quantification analysis the stability of solution is essential. Shelf life was determined by keeping the sample for 12 h, and it was estimated at -15 to -20 °C for 7 days. All the experiments were repeated six times.
Determination of quantitation limits (sensitivity)
Limit of detection LOD is the minute amount of analyte in a given method that may be detected, but not necessarily quantitated. To determine LOD of this method, 0.01 ppm of standard solution was injected five times and was set as LOD and the concentration was analyzed by using the formula LOD = 3.3 SD/slope and subjected to regression analysis, SD and % CV determination.
LOQ is the lowest concentration of the analyte that can be constituted having an acceptable degree of certainty [9]. Since the standard curve was examined from 10 to 100 ppm. Peak (response) was clearly identifiable, discrete and reproducible as requirement of Food and Drug Administration (FDA) guidance.
Statistical analysis
Statistical analysis of the both linearity curve of famotidine and flurbiprofen was applied for the calculation of coefficient of correlation values, slope and y axis intercept. Microsoft Excel 2007 was used for the evaluation of analysis of variance (ANOVA). Relative standard deviation (%RSD) was calculated using Eq 4.
Results
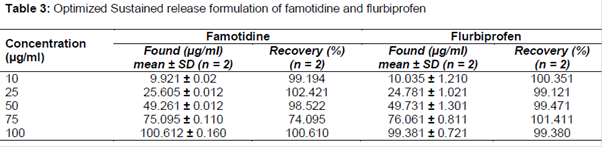
The method showed good sensitivity, selectivity, baseline resolved peaks and excellent resolution as required in method validation guidelines by the International Conference on the Harmonization of Pharmaceuticals for Human Use (ICH) Q2B [8]. Accuracy, precision, linearity, specificity, solution stability, system suitability, LOD and LOQ were successfully calculated. The results revealed that recovery was 99.611 % after 12 h and 99.760 % after 7 days for famotidine and 99.60 % for 24 h and 99.845 % after 7 days for flurbiprofen. Temperature effect on the Flurbiprofen and Famotidine at ambient and freeze form are shown in table 1. Ambient temperature 15-20 °Ċ were applied for 7 days in 50 ppm solution of flurbiprofen and famotidine. Similarly, relative standard deviation (%RSD) of area for both drugs was 0.175 and 1.327 which is < 2. Theoretical plates were 4156.6 for flurbiprofen and 6532.2 for famotidine. RSD of tailing factor was 0.986 and 0.154 % for flurbiprofen and famotidine, respectively, and was within limit of < 2. LOD was 10 ppm while LOQ was 50 ppm. No detection of interfering recipients was detected between sample, standard and placebo as shown in . For the evaluation of resolution and reproducibility of the method, the results of the system suitability test are shown in while accuracy results are shown in table 3. By injecting replicate injections of five selected concentrations 100,75,50,25 and 10 ppm gave the evidence of accuracy showed the percent recovery for each concentration of Famotidine and Flurbiprofen respectively. Statistical data results such as coefficient of correlation was found to be 0.999 in Famotidine while it was 0.999 in Flurbiprofen which showed linear regression as shown in and . Interdev (%RSD) precision results of 0.075, 0.383, 0.775, 0.103, 0.155 and 0.16, 1.16, 0.15, 0.77, 0.445 for flurbiprofen and famotidine respective concentration. The result of Intraday (%RSD) was 0.74, 1.97, 0.774, 0.66, 0.156 for flurbiprofen and (%RSD) for famotidine it was found 0.07, 1.56, 0.49, 0.06, 0.034 and analysis was found to be less 2 % as shown in .
Discussion
The retention time for placebo and blank chromatograms were 16.823 and 6.613 min respectively. Similar studies were also performed by Hanif et al to evaluate the Nimesulide concentration in tablet dosage form [9]. Lesser in retention time will provide the benefit of less consumption of mobile phase and less time needed for the assay of both drugs. Retention time for system suitability was 2.457 min for flurbiprofen and 4.163 min for famotidine. Similarly percentage relative standard deviation (%RSD) of area for both drugs was 0.175 and 1.327 which is less than 2. Theoretical plates were found 4156.6 for flurbiprofen and 6532.2 for famotidine. A % RSD value of tailing factor was 0.986 and 0.154 for flurbiprofen and famotidine respectively and was found within limit less than 2. Similarly stability of amlodipine besylate and atenolol in multi-component tablets of mono-layer and bi-layer types were studied by Aryal et al in 2008 and developed a single mobile phase to specify of the reported method [13].
For determination of linearity, five concentrations (ICH, 1996) having an equal spaced i.e. 100, 75, 50, 25, 10 ppm were applied and their recovery were found to be 9.92, 25.605, 49.56, 75.095, 100.6 ppm respectively for famotidine and 10.035, 24.78, 49.73, 76.06, 99.38 ppm for flurbiprofen. In similar study Linearity values of pseudoephedrine and cetirizine was also developed after compressing the bilayer tablet and developing single mobile phase for both drugs [14]
System suitability parameters include Relative Standard Deviation (RSD), Percentage of Retention Time, Peak area, Tailing Factor and Theoretical plates were observed as expressed in . All results were within limits of ICH guideline. Shah et al reported same results after studying the combined formulation [15]. Similarly succinate and amlodipine was studied in bilayerd tablets formulations and reported the system suitability with its theoretical plates values [16].
By injecting replicate injections of five selected concentrations 100,75,50,25 and 10 ppm gave the evidence of accuracy showed the percent recovery for each concentration of Famotidine and Flurbiprofen respectively. Similar findings were reported for determination of Flurbiprofen by HPLC and reported the accuracy level of five different concentrations [17]. Ampicillin and cloxacillin were in the combined formulation was studied and reported accurate and precise method for both drugs [18].
For the determination of precision intraday and inter-day analyses were carried out by injecting twice the five concentrations of 100, 75, 50, 25, 10 ppm of both Famotidine and Flurbiprofen were applied on the same day and for three consecutive days. Interday (%RSD) precision results of 0.075, 0.383, 0.775, 0.103, 0.155 and 0.16, 1.16, 0.15, 0.77, 0.445 for flurbiprofen and famotidine respective concentration. The result of intraday (%RSD) was 0.74, 1.97, 0.774, 0.66, 0.156 for flurbiprofen and (%RSD) for famotidine it was found 0.07, 1.56, 0.49, 0.06, 0.034 and analysis was found to be less 2 % as shown in . Similar finding were also reported by after explaining the HPLC method validation of Nimesulide tablets [9]. Atorvastatin and amlodipine were studied in combined formulation and reported the isocratic mobile phase of both drug after using the range of 1-90 mg/ml.
Conclusion
The HPLC method used shows good separation, linearity, precision, accuracy and selectivity for the simultaneous analysis of the two drugs, and it should also be convenient, simple and reliable to use, not only in vitro analysis, but also in vivo studies.
References
Archives


News Updates